£676.60 a week: where a British household’s money actually goes
The average household spends £676.60 a week, about £2,930 a month. The largest shares go on housing and energy at £118.40 and transport at £96.40. The gap between the richest and poorest fifth has widened to 2.7 times — and equals an entire average household’s weekly budget.
Thanks for £1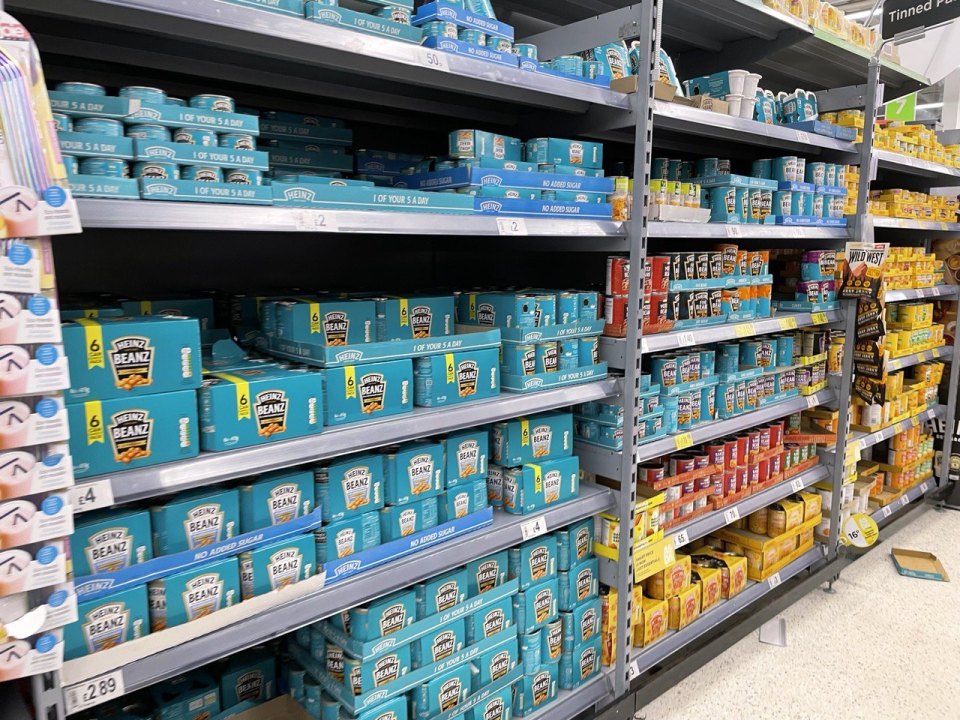
The statistics office measures how much a British household spends in a week and on what. The figures for the financial year from April 2024 to March 2025 give a benchmark worth checking your own budget against.
The headline figure
The average household spent £676.60 a week. That is £53.30 more than the year before, a rise of 9%. Adjusted for inflation the increase is more modest: £35.10, or 5%.
Converted to a month, that is about £2,930 per household.
And one caveat that is easy to miss: despite the increase, spending is still £75.60 a week lower than in the financial year ending 2020. Households have not returned to their pre-pandemic level.
Where the money goes
The largest category is housing, fuel and power: £118.40 a week, or 18% of all spending, up £5.60 over the year.
Second is transport: £96.40, or 14%. And transport produced the biggest increase of the year — up £8.10, or 9%.
A caveat from the office itself is needed here, or the housing share misleads. Mortgage interest payments and Council Tax are not in that category — they sit under "other expenditure items". So housing's real share of the budget is higher than 18%.
 ONLYWAY NEWSLIVEMoney · 15.11The missing pension top-up: how to reclaim HRP years for caringMoney · 14.11Energy standing charges: what you pay even at zero usageLaw · 14.11Exchanging a foreign driving licence: who can skip the tests and who cannotBooks · 14.11The Water-Babies by Charles Kingsley — bedtime book: extract, author and a journey to the placesUK & Politics · 14.11King's Award for Voluntary Service: 250 groups honoured across BritainMarkets · 14.11Brexit barriers hit profits for over half of UK food and drink exportersJobs & Business · 14.11Youth Guarantee: Biffa opens up to 2,000 jobs for young peopleLife · 14.11Compare schools online: how to choose your child's school in EnglandTravel · 14.11A quarter more vans, fewer buses: how travel in Britain has changedLife · 14.11Forever chemicals in England’s rivers: PFOS down 30%, and nearly halved in fishONLYWAY NEWS · appInstall the ONLYWAY NEWS appFresh UK news, classifieds, key dates and exchange rates on your home screen, one tap away. Free.NewsClassifiedsCalendarRates
Food and non-alcoholic drinks rose by £3.20, but almost all of that is price: in real terms the increase is only £1.60, or 2%.
What rose fastest
Net rent rose by £7.00 a week — 14% in nominal terms, but only 6% after inflation.
Mortgage interest added £3.80, also 14%. The office attributes this to households continuing to move off lower fixed-rate deals.
Energy did something curious. In cash terms spending fell by £4.60, down 11% — Ofgem's price cap came down over the period. But in real terms it rose by £2.20, or 7%.
Second-hand cars are a story of their own: up £5.50 a week, a real-terms rise of 25%.
What people chose to spend more on
Package holidays abroad: up £5.80 nominally, 21%, and £4.10 after inflation.
Sport — admissions, subscriptions, classes and equipment hire — rose 29% and 35% across different lines. Restaurants and cafés, 9% and 13%.
The office's conclusion reads almost sympathetically: households face unavoidable price rises, but where they can, they are spending more on personal transport and leisure.
The gap between rich and poor widened
The richest fifth of households spent £1,083.60 a week, the poorest fifth £407.30. A gap of 2.7 times against 2.5 a year earlier, the largest widening since 2021.
The cause is speed: the richest increased spending by £98.10 (10%), the poorest by £18.10 (5%). Half the rate.
Work it out: the difference between the top and bottom fifth is £676.30 a week. That is, to within thirty pence, the entire weekly budget of an average household.
The office also notes the different nature of the spending. Since the inflation peak, the poorest increased real spending on rent, food and energy. The richest, on second-hand cars and holidays abroad.
The backdrop
Over the same period the national minimum wage rose 9.8%, from £10.42 to £11.44 an hour. Median weekly earnings were up 4.7%.
Inflation over the 12 months to March 2025 was 2.6%. So earnings outpaced prices. But the spread within the basket is wide: housing, fuel and power came in at 5.5%, double the headline rate.
One more thing: the data runs to March 2025 and does not capture later increases in fuel prices. The office flags that separately.
Thanks for £1If this information was useful and came in time, press the heart. Payment goes through PayPal, with nothing to choose and nothing to fill in, and it pays for the newsroom.


- Life Russian-language events in London: verified dates to December 2026
- Life Where to buy the food you grew up with in London: Russian, Ukrainian, Polish and Baltic shops
- Immigration UK immigration rules change on 8 October 2026: what is new
- Travel England's railways move into public ownership: who has transferred and what it means for tickets
- Jobs & Business Post Your Ad Free
- Life Free English with a native speaker: how Russian speakers can find a language partner
- Immigration UK visa waiting times in 2026: the official UKVI timelines and how to get a decision in a day